Other use-cases
Whilst the extension generates the metrics and plot these onto the dashboard, there are some other features that you can leverage by doing additional configuration
Know your generated metrics
Extension will create the following metrics (depending on your configuration) that can be leveraged
Problem Analysis
| Metric Name                          | Dimensions                           |      Generated by configuration           |
|--------------------------------------|--------------------------------------|-------------------------------------------|
| Problem Analysis                     |        Application Problem           |  Capture and report problem data          |
| Problem Analysis                     |        Availability Problem          |  Capture and report problem data          |
| Problem Analysis                     |        Custom Problem                |  Capture and report problem data          |
| Problem Analysis                     |        Environment Problem           |  Capture and report problem data          |
| Problem Analysis                     |        Error Problem                 |  Capture and report problem data          |
| Problem Analysis                     |        Infrastructure Problem        |  Capture and report problem data          |
| Problem Analysis                     |        Mean Resolution Time          |  Capture and report problem data          |
| Problem Analysis                     |        Performance Problem           |  Capture and report problem data          |
| Problem Analysis                     |        Resource Problem              |  Capture and report problem data          |
| Problem Analysis                     |        Service Problem               |  Capture and report problem data          |
| Problem Analysis                     |        Total Problems                |  Capture and report problem data          |
Incident metrics
| Metric Name                          | Dimensions                            |      Generated by configuration           |
|--------------------------------------|---------------------------------------|-------------------------------------------|
| reported_application_problems         |    mgmt_zone,Custom Device           | Capture problem data per management       |
| reported_availability_problems        |    mgmt_zone,Custom Device           | Capture problem data per management       |
| reported_custom_problems              |    mgmt_zone,Custom Device           | Capture problem data per management       |
| reported_error_problems               |    mgmt_zone,Custom Device           | Capture problem data per management       |
| reported_infra_problems               |    mgmt_zone,Custom Device           | Capture problem data per management       |
| reported_performance_problems         |    mgmt_zone,Custom Device           | Capture problem data per management       |
| reported_resource_problems            |    mgmt_zone,Custom Device           | Capture problem data per management       |
| total_reported_problems               |    mgmt_zone,Custom Device           | Capture problem data per management       |
| mttr_rca                              |    mgmt_zone,Custom Device           | Capture problem data per management       |
| mttr_wo_rca                           |    mgmt_zone,Custom Device           | Capture problem data per management       |
Create Customized Benefits Valuation/Dashboard Reports
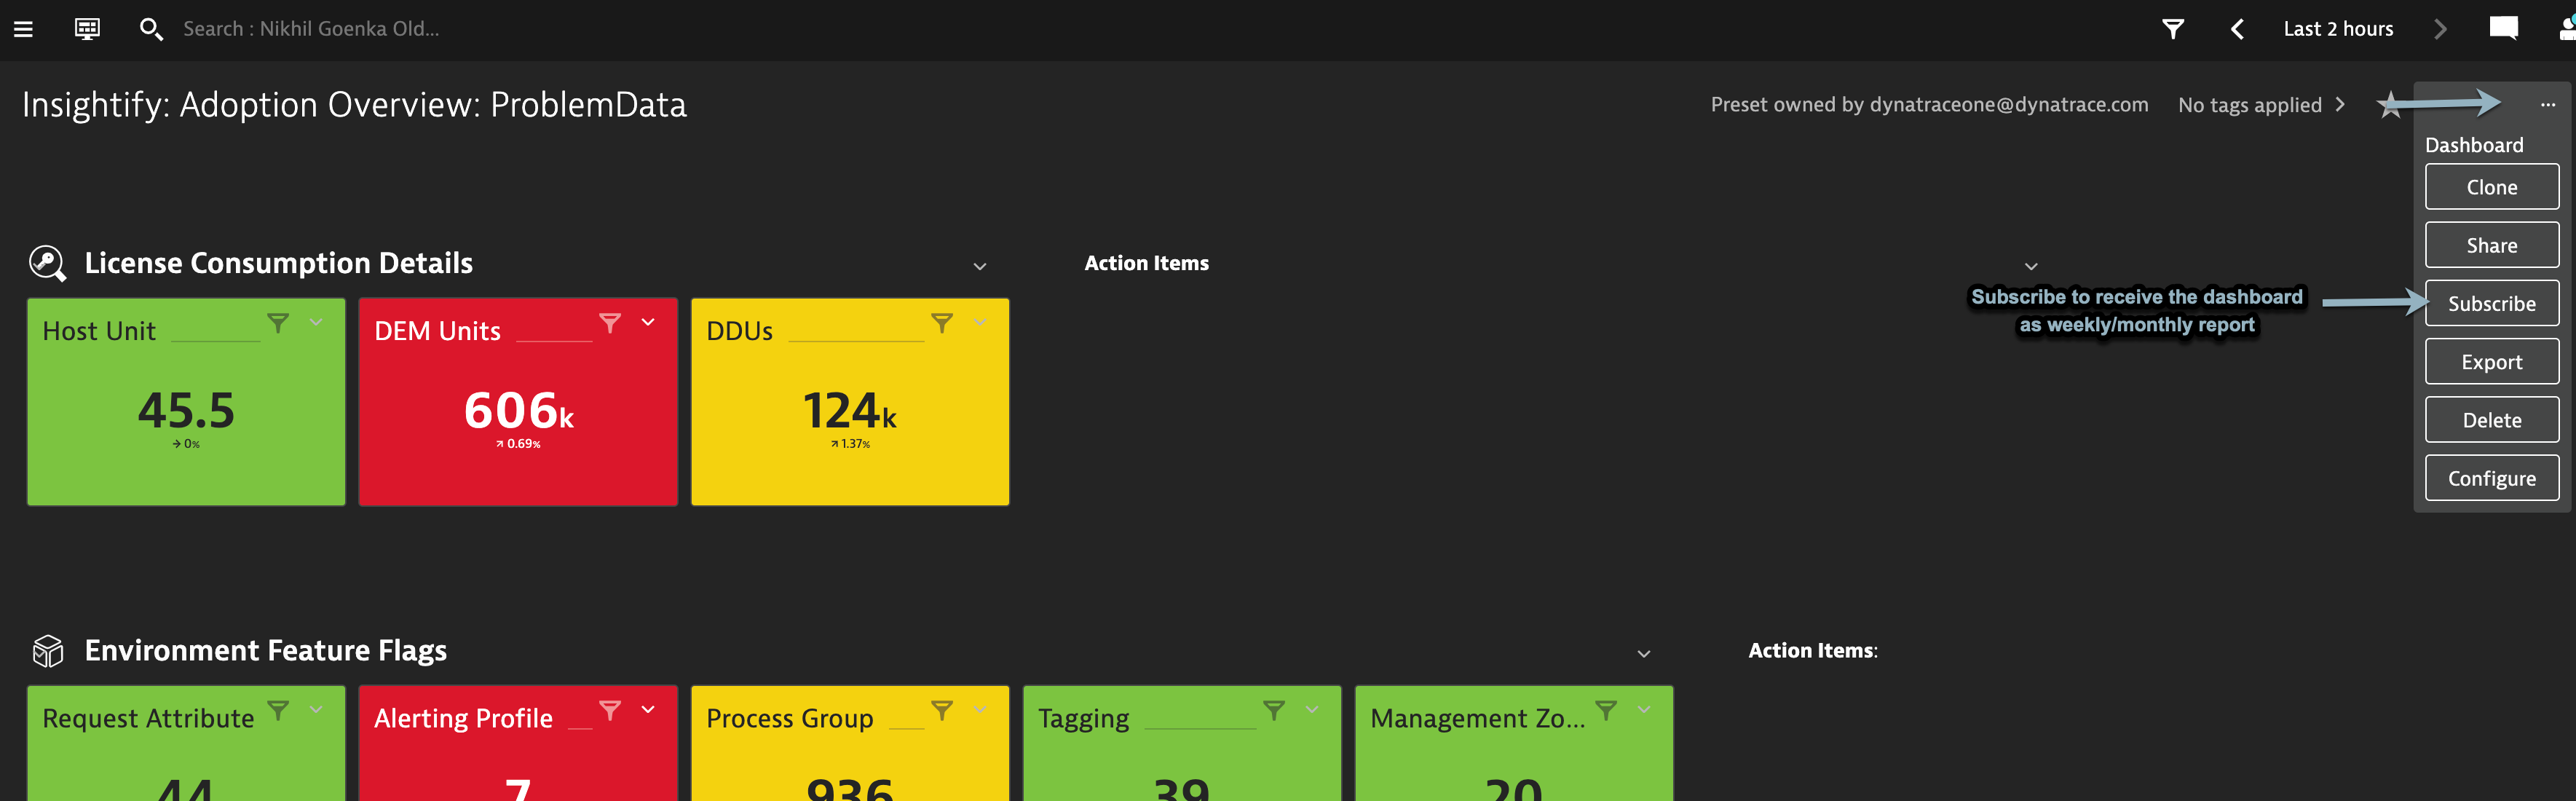
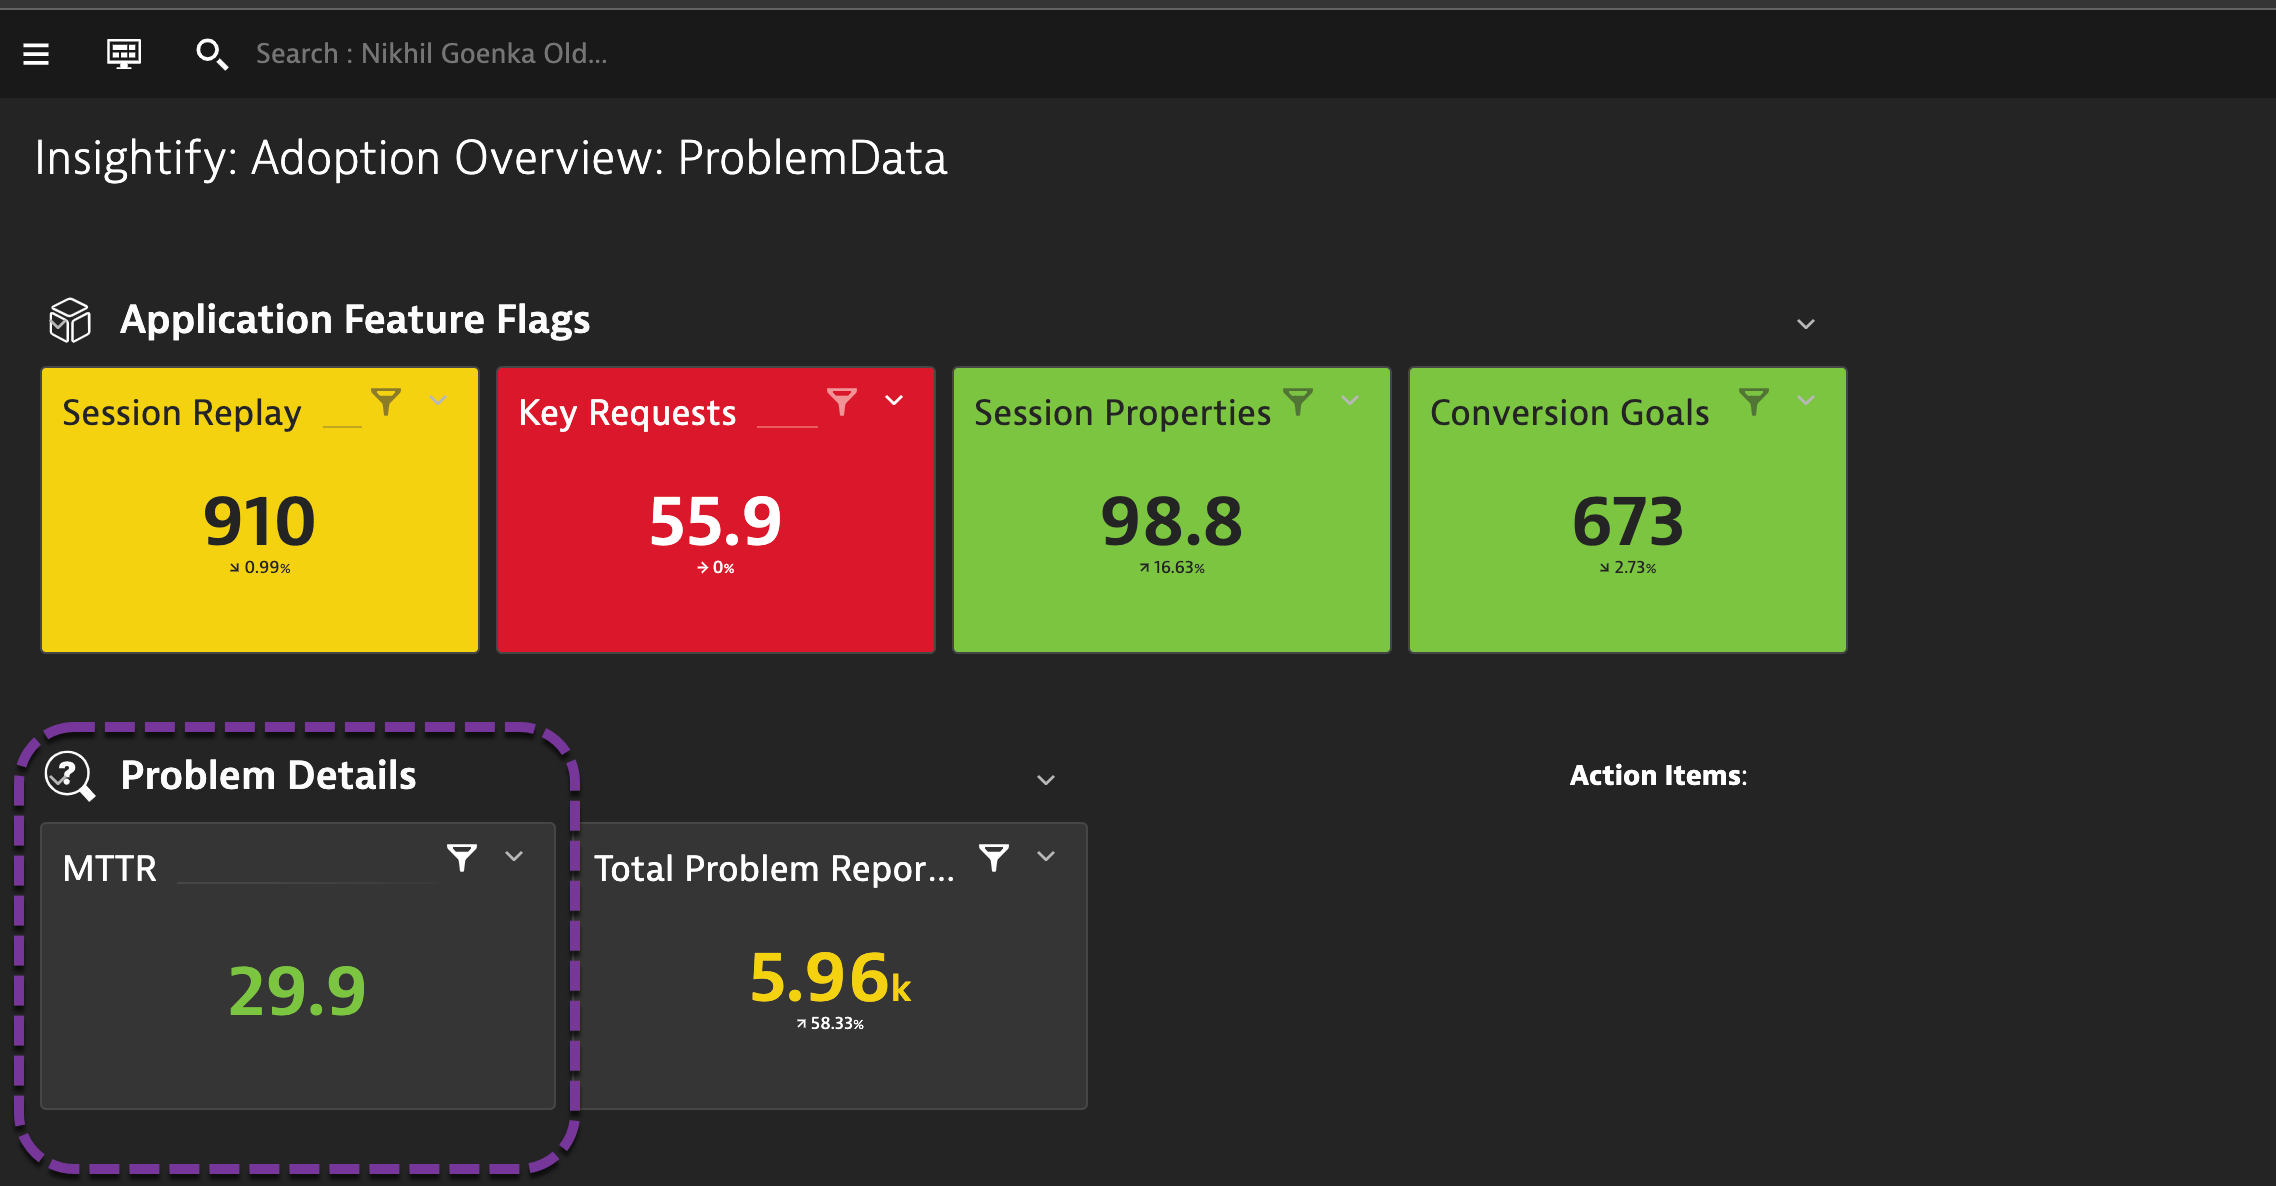
Using the metrics available within the extension, create customised dashboards for showcasing Benefits Relisation. For example, using the problems data I created a dashboard as below that provides quick sneak peak into different aspects of Problems generated, RCA available, MTTR when RCA is available, etc.
Dashboard Reports
End-user can subscribe to get the dashboard reports weekly or monthly. More details on how to can be found in our help documentation link
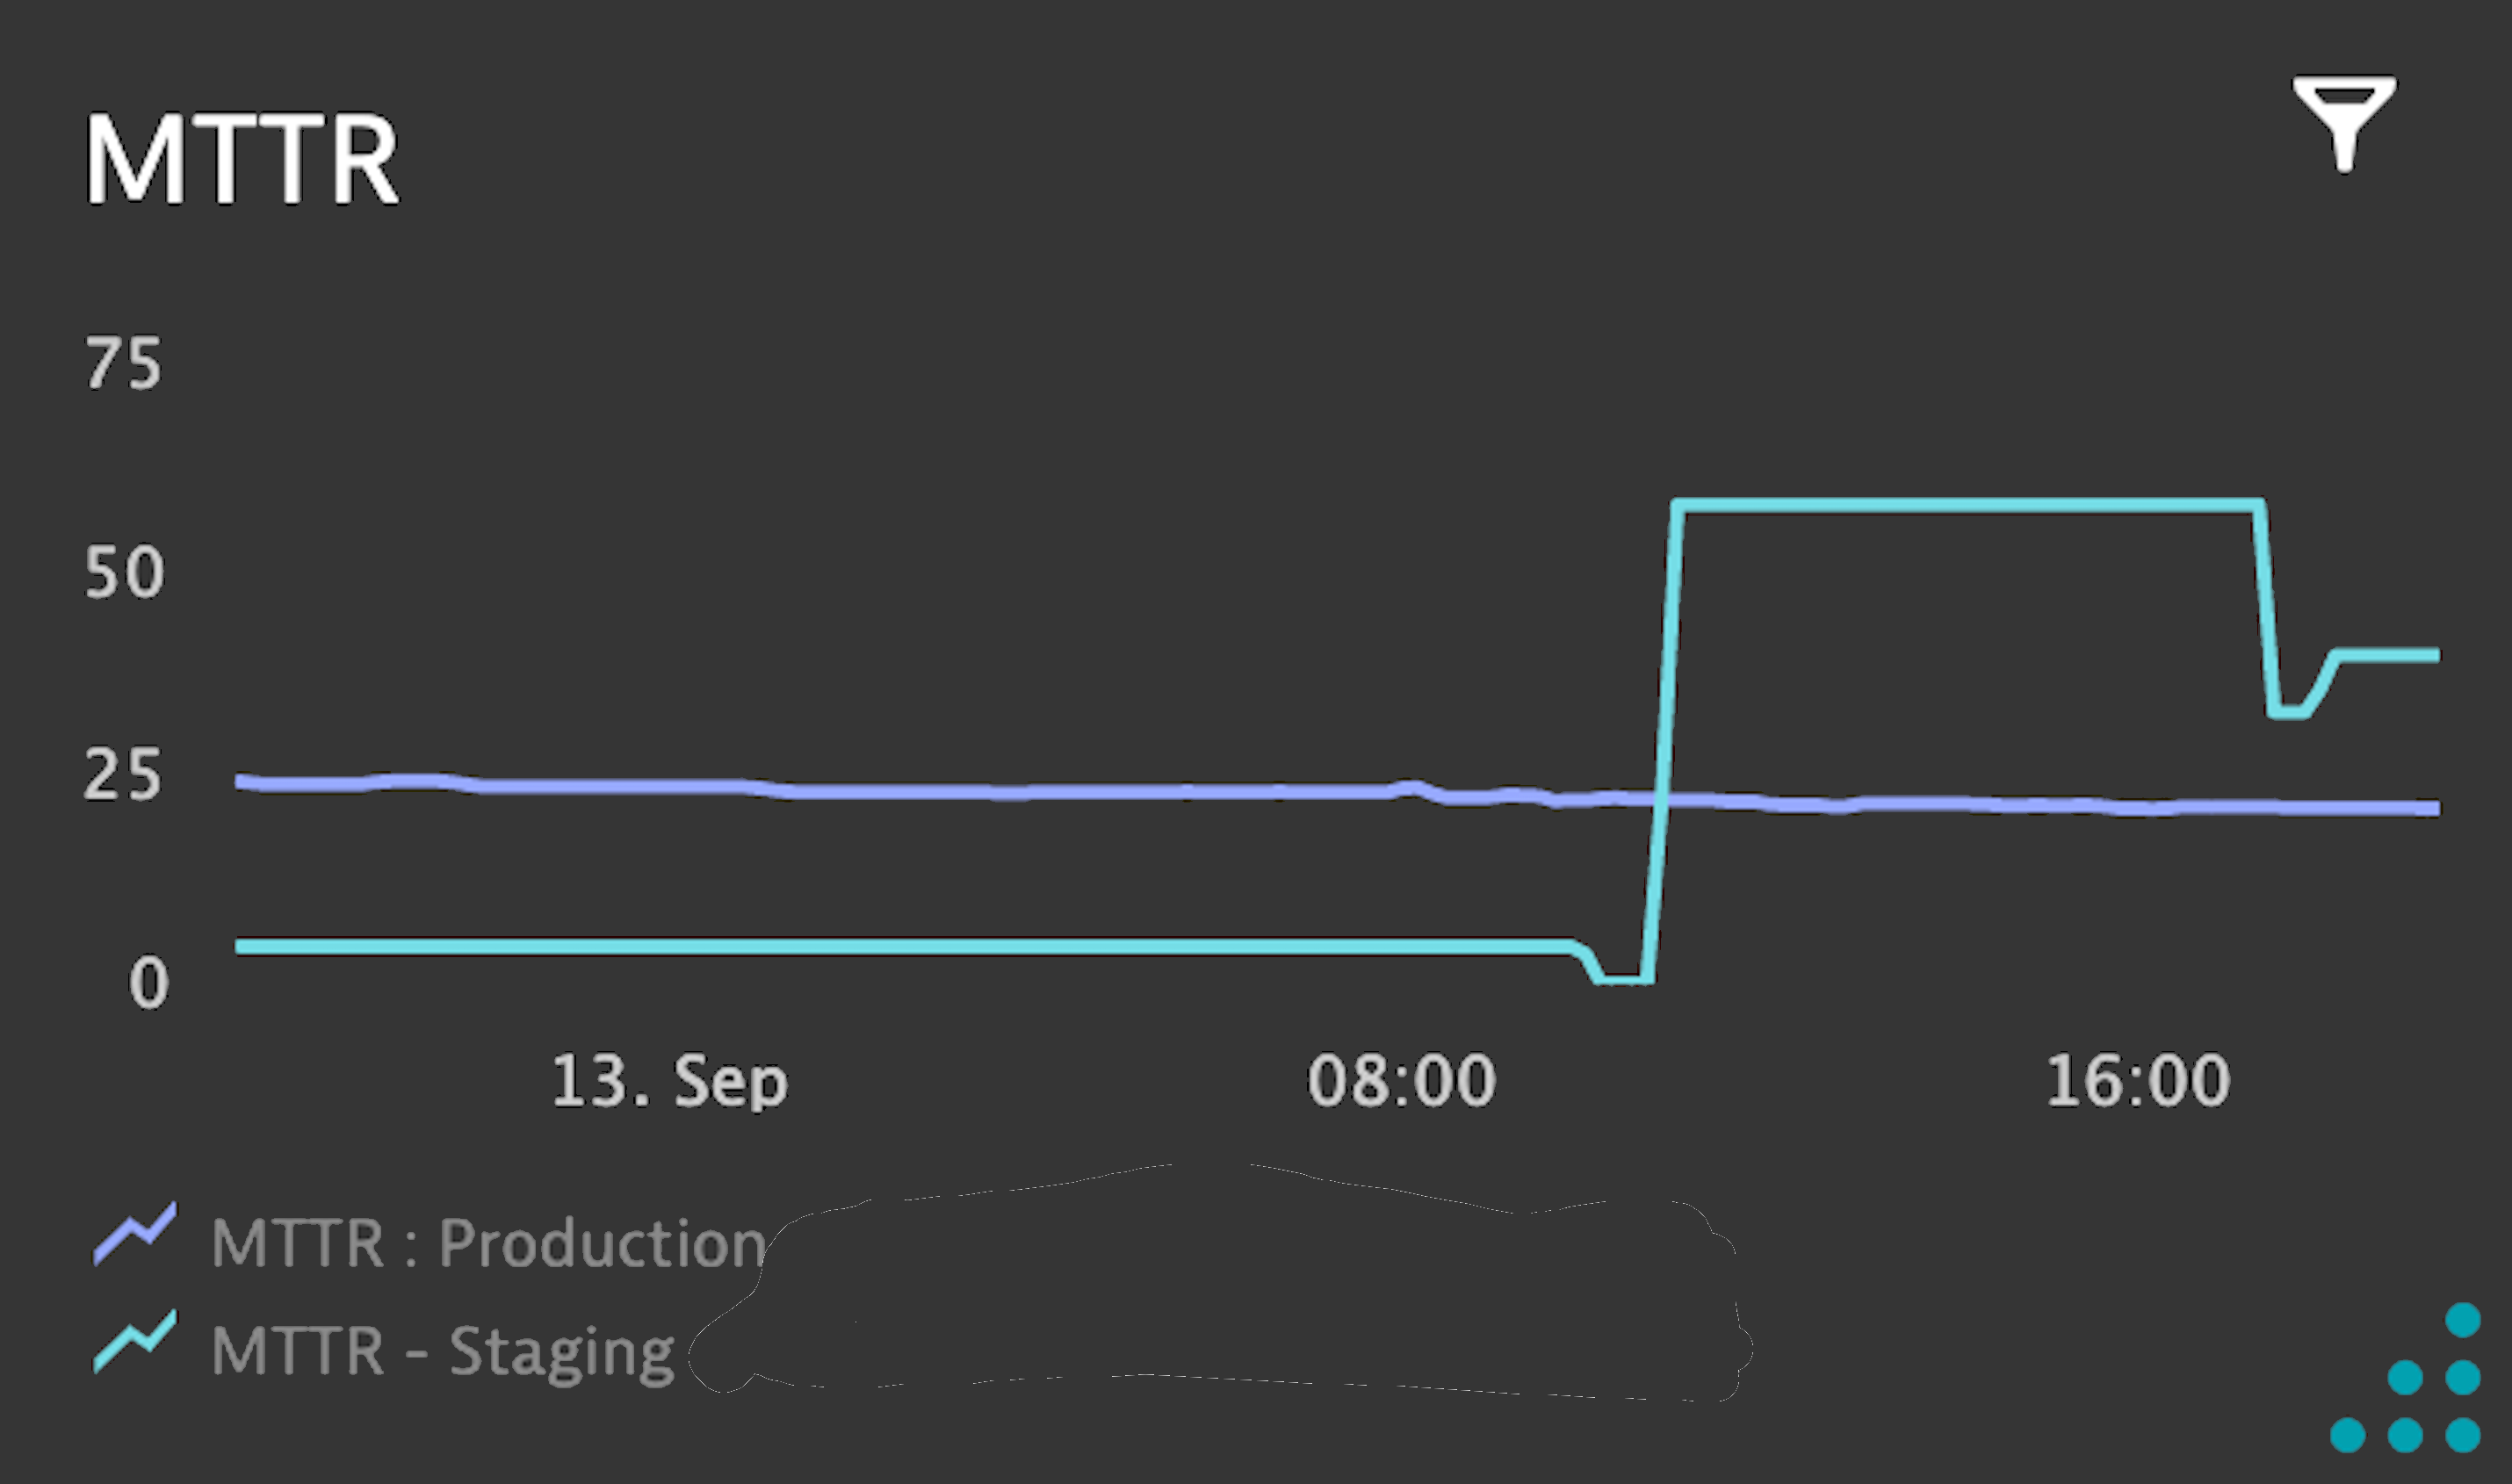
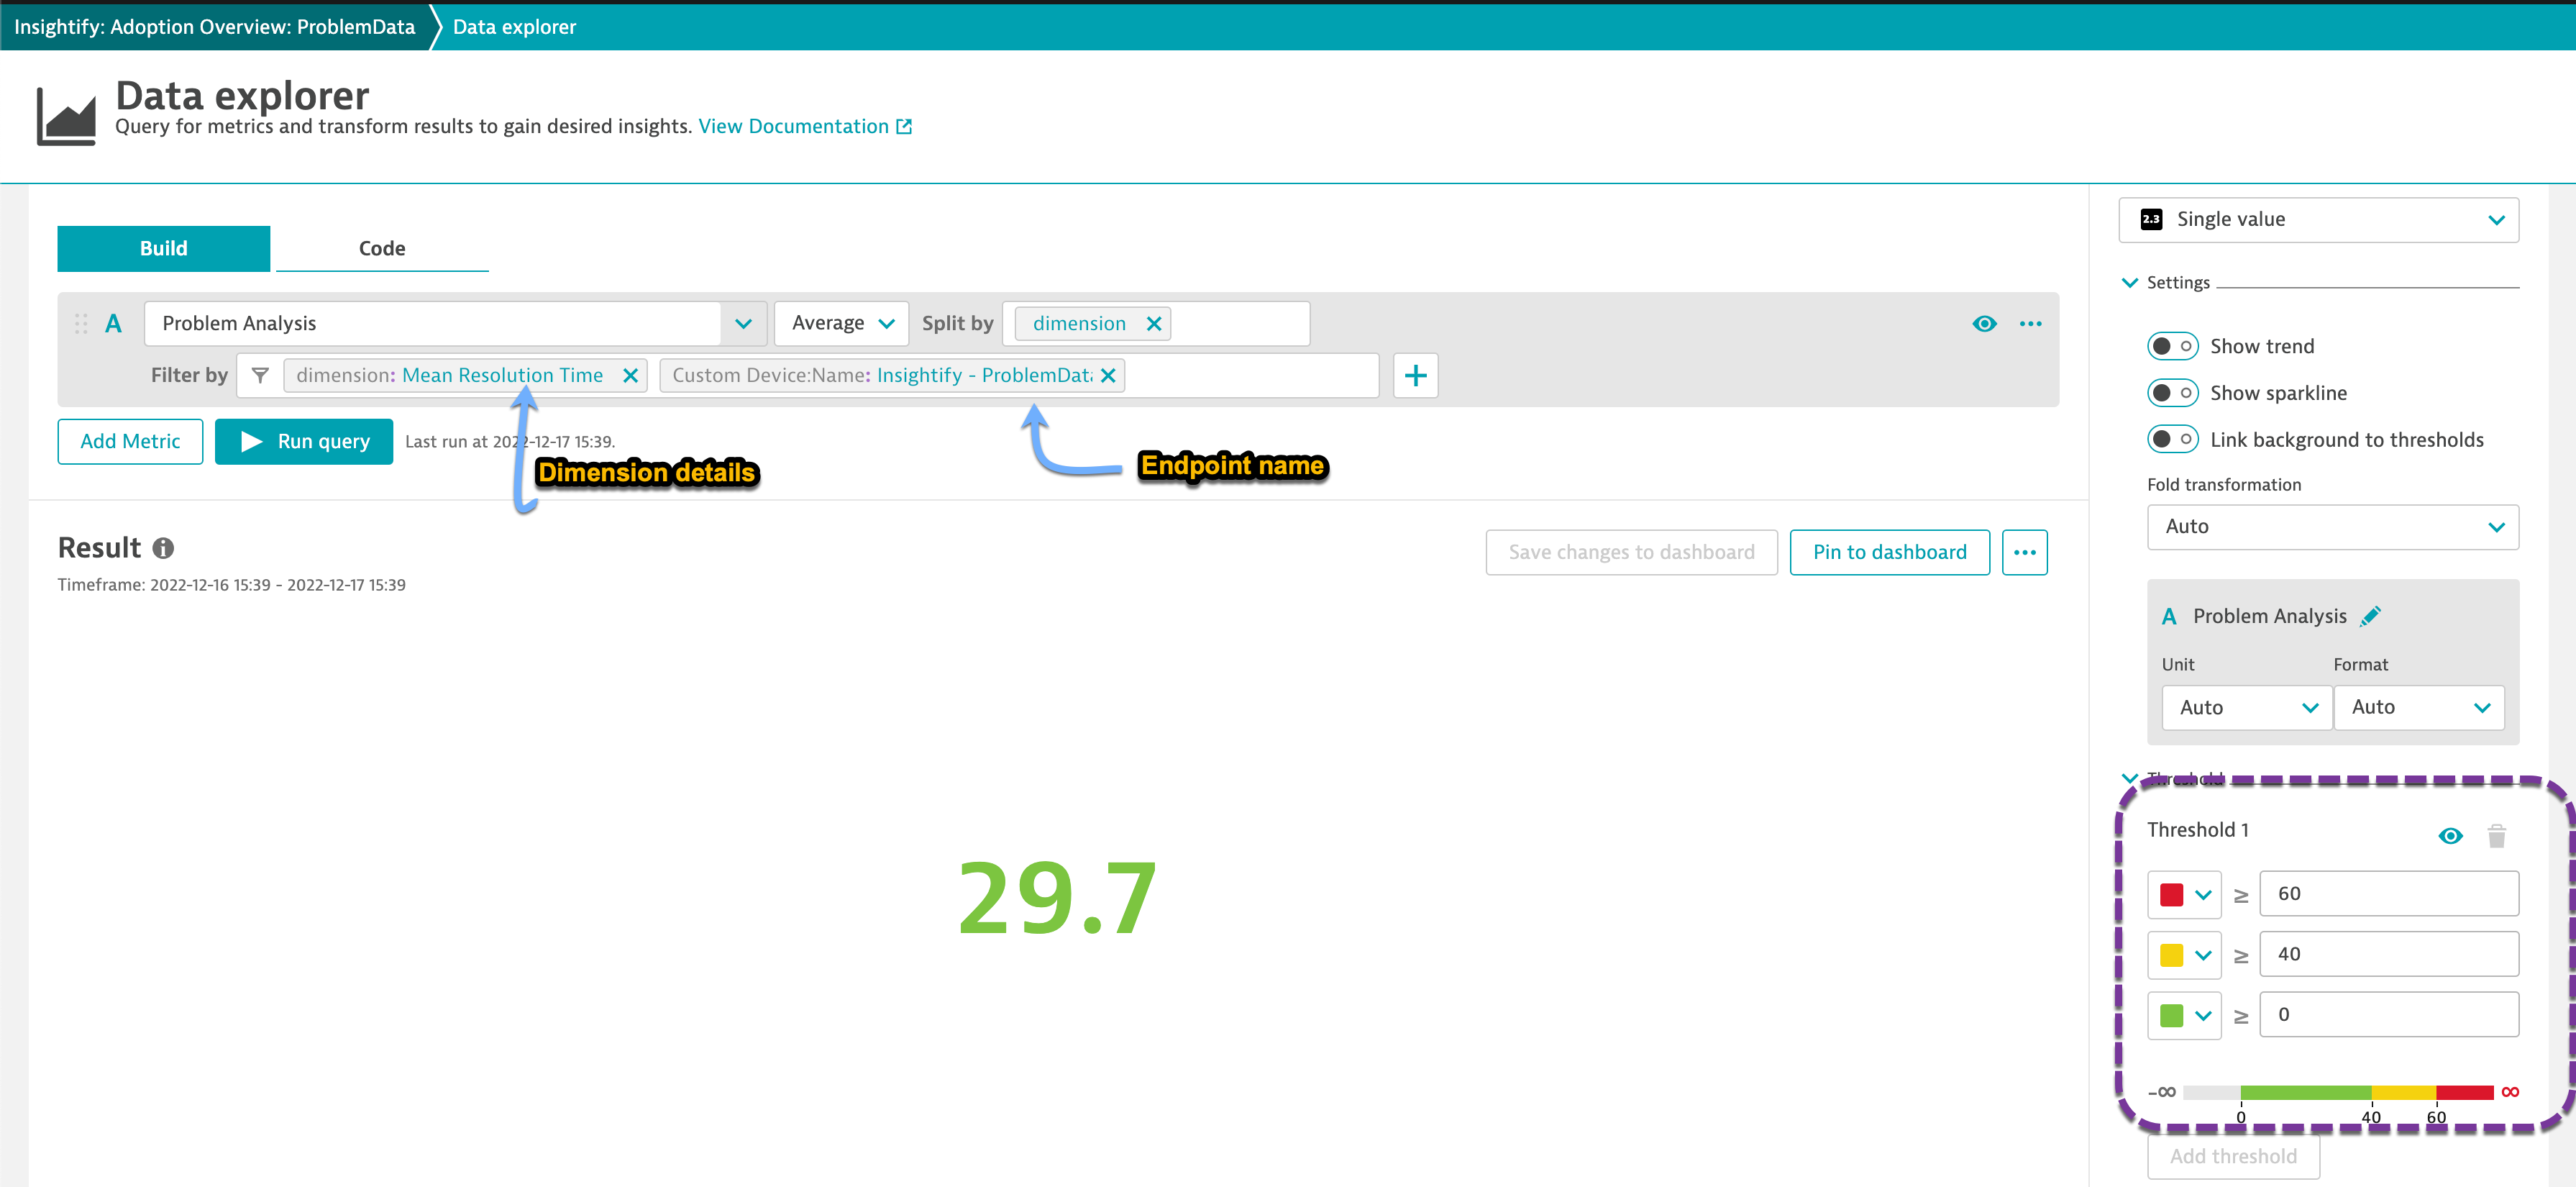
Single value trend
Navigate to the Data Explorer screen for a specific metric and set expected thresholds for a specific metric. This can be powerful to get a quick view of say MTTR, etc.
Setting custom alerts
You can setup custom alerts on any of the generated metrics so as to be alerted for any abberations. This could be particularly useful for use-cases wherein you as an end-user would like a specific group to be notified once their consumption goes beyond a threshold. To setup a custom alert, navigate to Settings > Anomaly Detection >> Custom events for alerting and set the threshold.
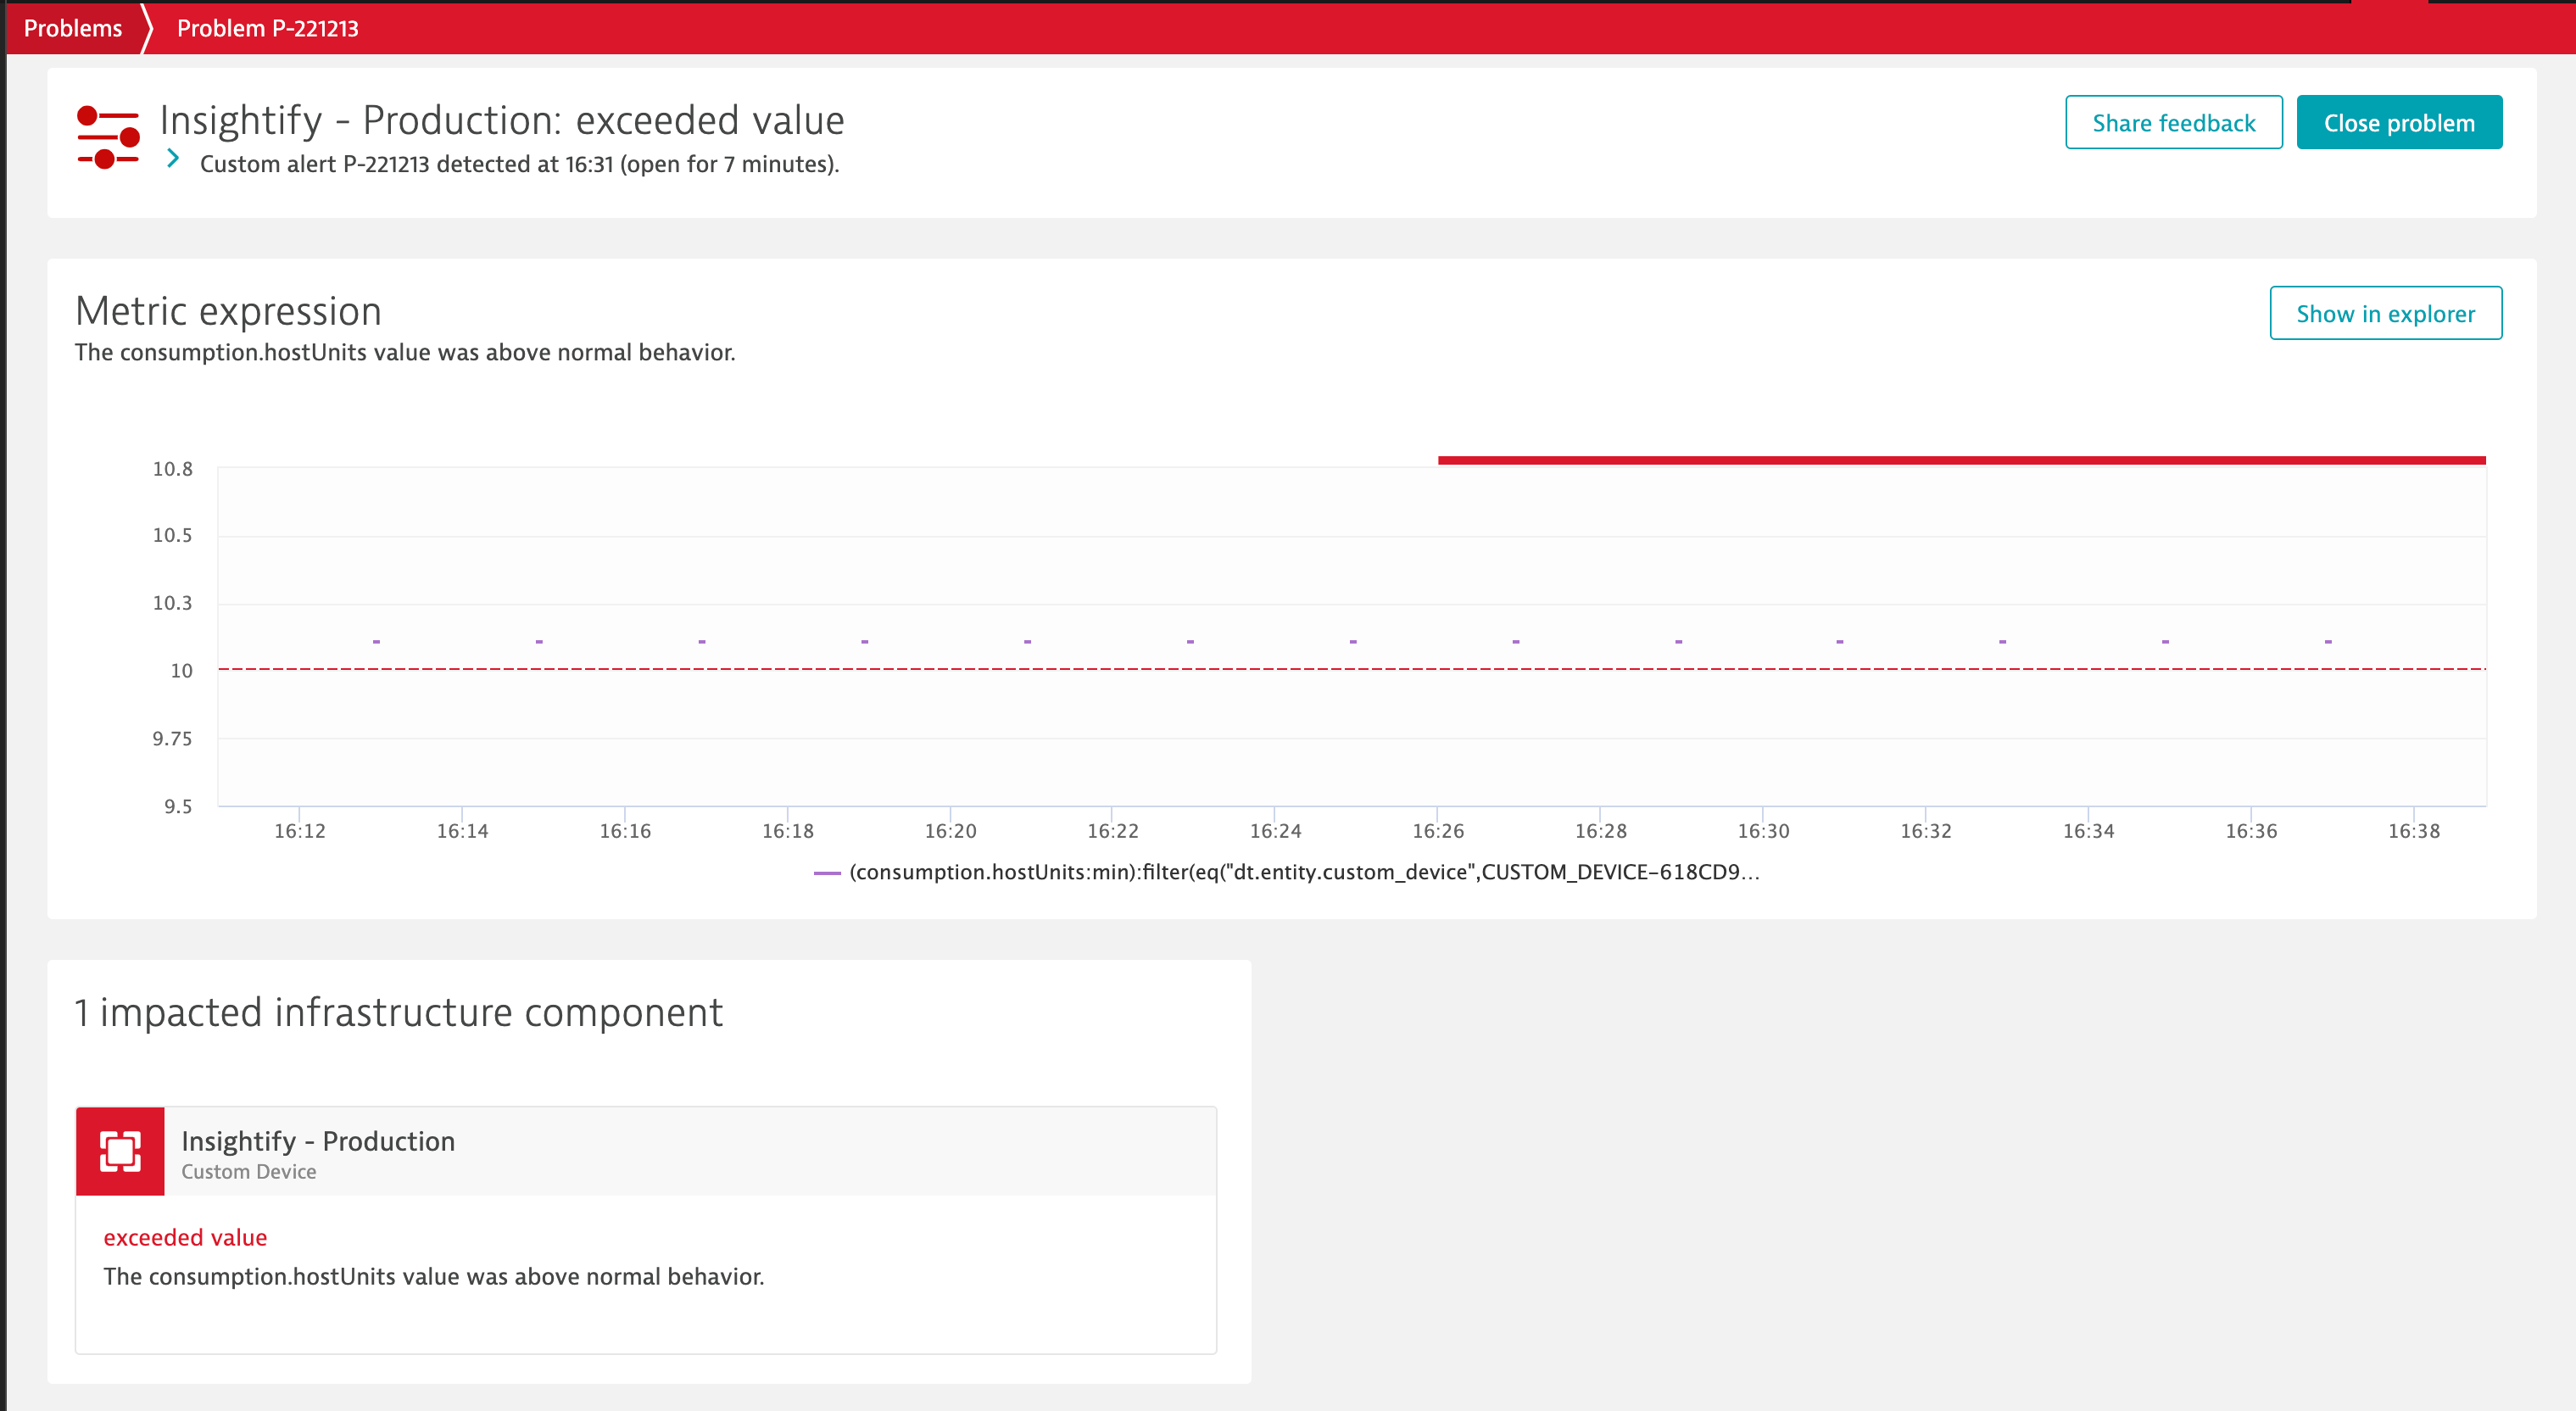
In the above screenshot, a custom alert is setup for management zone Cloud:AWS to be alerted whenever the host consumption in endpoint Non-prod breaches 200.
Compare consumption or adoption metrics across different endpoints
You can setup reports to compare adoption data or license data across different endpoints to give an overview how the different tenants are utlizing/adopting Dynatrace. To compare across tenants, navigate to Data explorer and split the metric(s) across different endpoints.
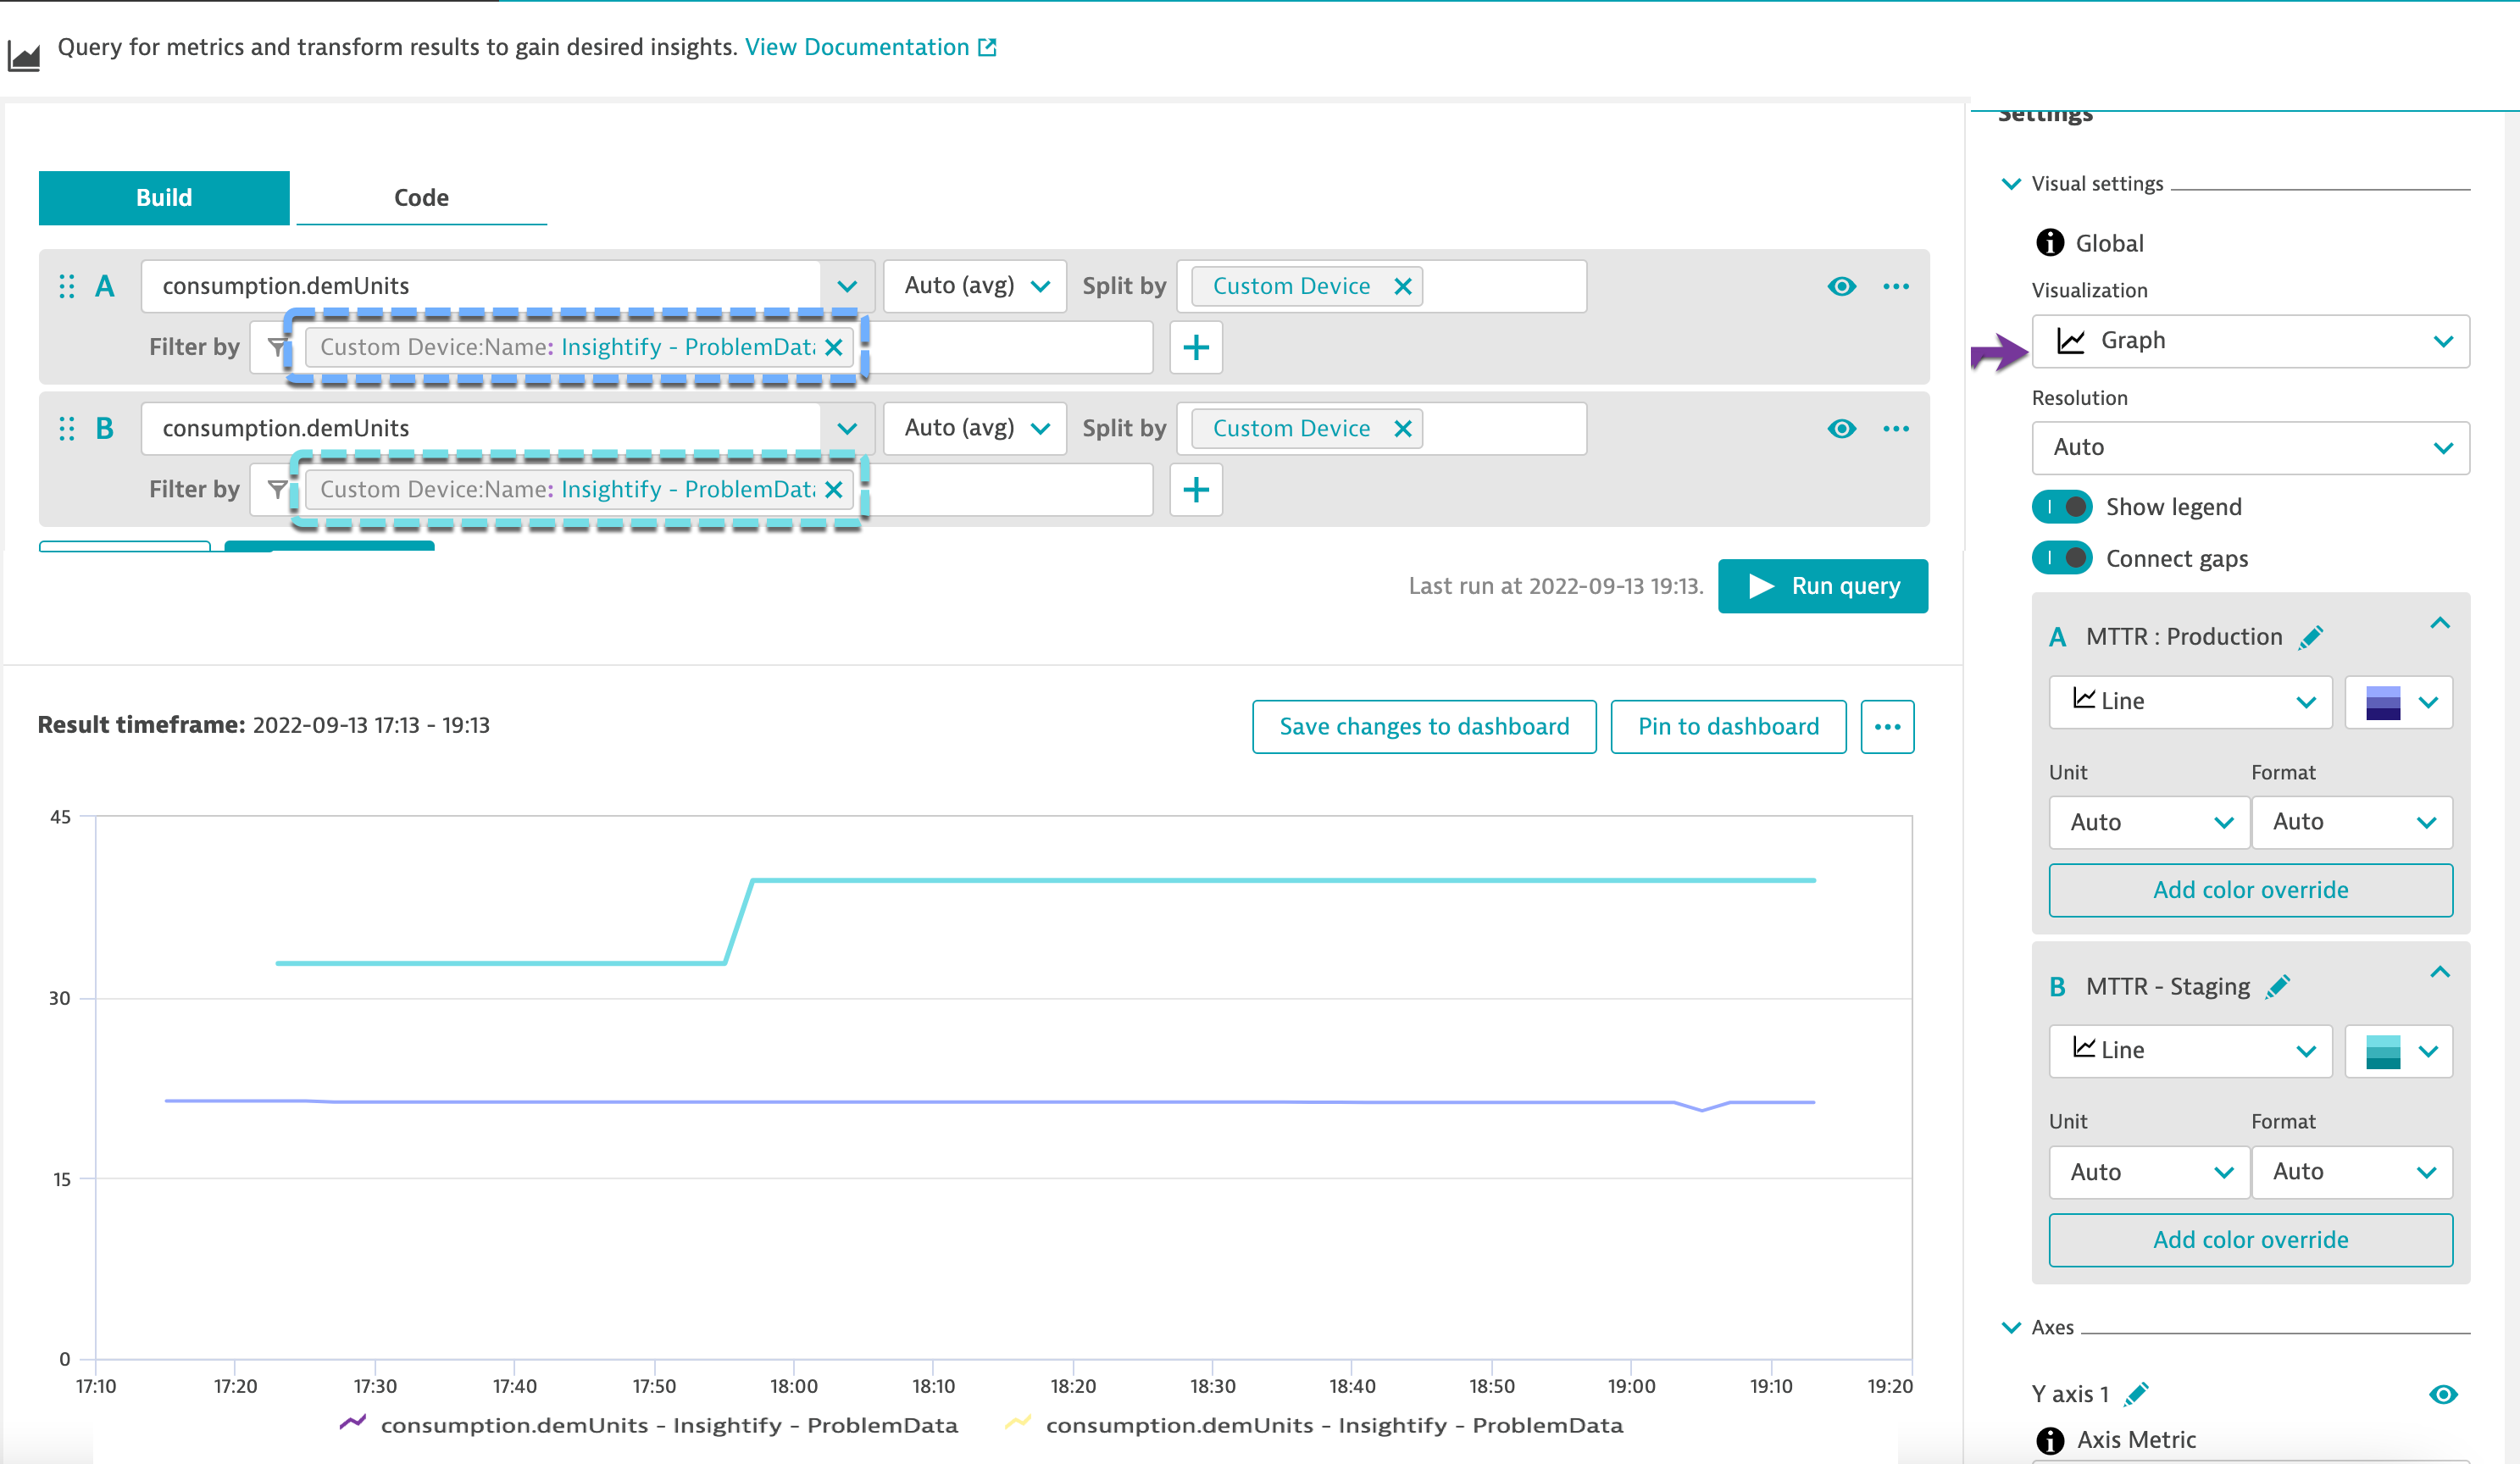
This can be further pinned back to the dashboard by clicking on Pin to Dashboard.